
“What gets measured gets managed, but only if you’re measuring the right things at the right time.” Adapted from Peter Drucker
Did you know that 73% of high-performing organizations use both leading and lagging indicators in their performance frameworks (Harvard Business Review research)? Yet many businesses still rely heavily on historical results while overlooking the predictive signals that shape future outcomes.
This imbalance explains why companies often feel blindsided. Revenue appears healthy. Productivity seems stable. Reports are green across the board. Then, unexpectedly, a major client churns, engagement drops, or operational performance dips.
The issue is rarely effort. It is measurement.
Understanding the difference between leading and lagging indicators, and learning how to balance them, is one of the most strategic moves an organization can make. In this guide, we’ll explore what these metrics mean, how they connect, common pitfalls, and how to build a balanced framework that supports long-term success.
What Are Lagging Indicators?
Lagging indicators measure outcomes that have already occurred. They are historical in nature and reflect the final results of past decisions and actions.
Common Examples of Lagging Indicators:
Revenue
Net profit
Customer satisfaction scores
Employee turnover rates
Market share
Project completion rates
Lagging indicators are powerful because they are:
Objective
Quantifiable
Easy to verify
Highly defensible in executive and board discussions
However, they share one limitation: timing.
By the time a lagging metric declines, the root cause has already happened. If customer retention drops this quarter, the dissatisfaction that caused it likely occurred months earlier.
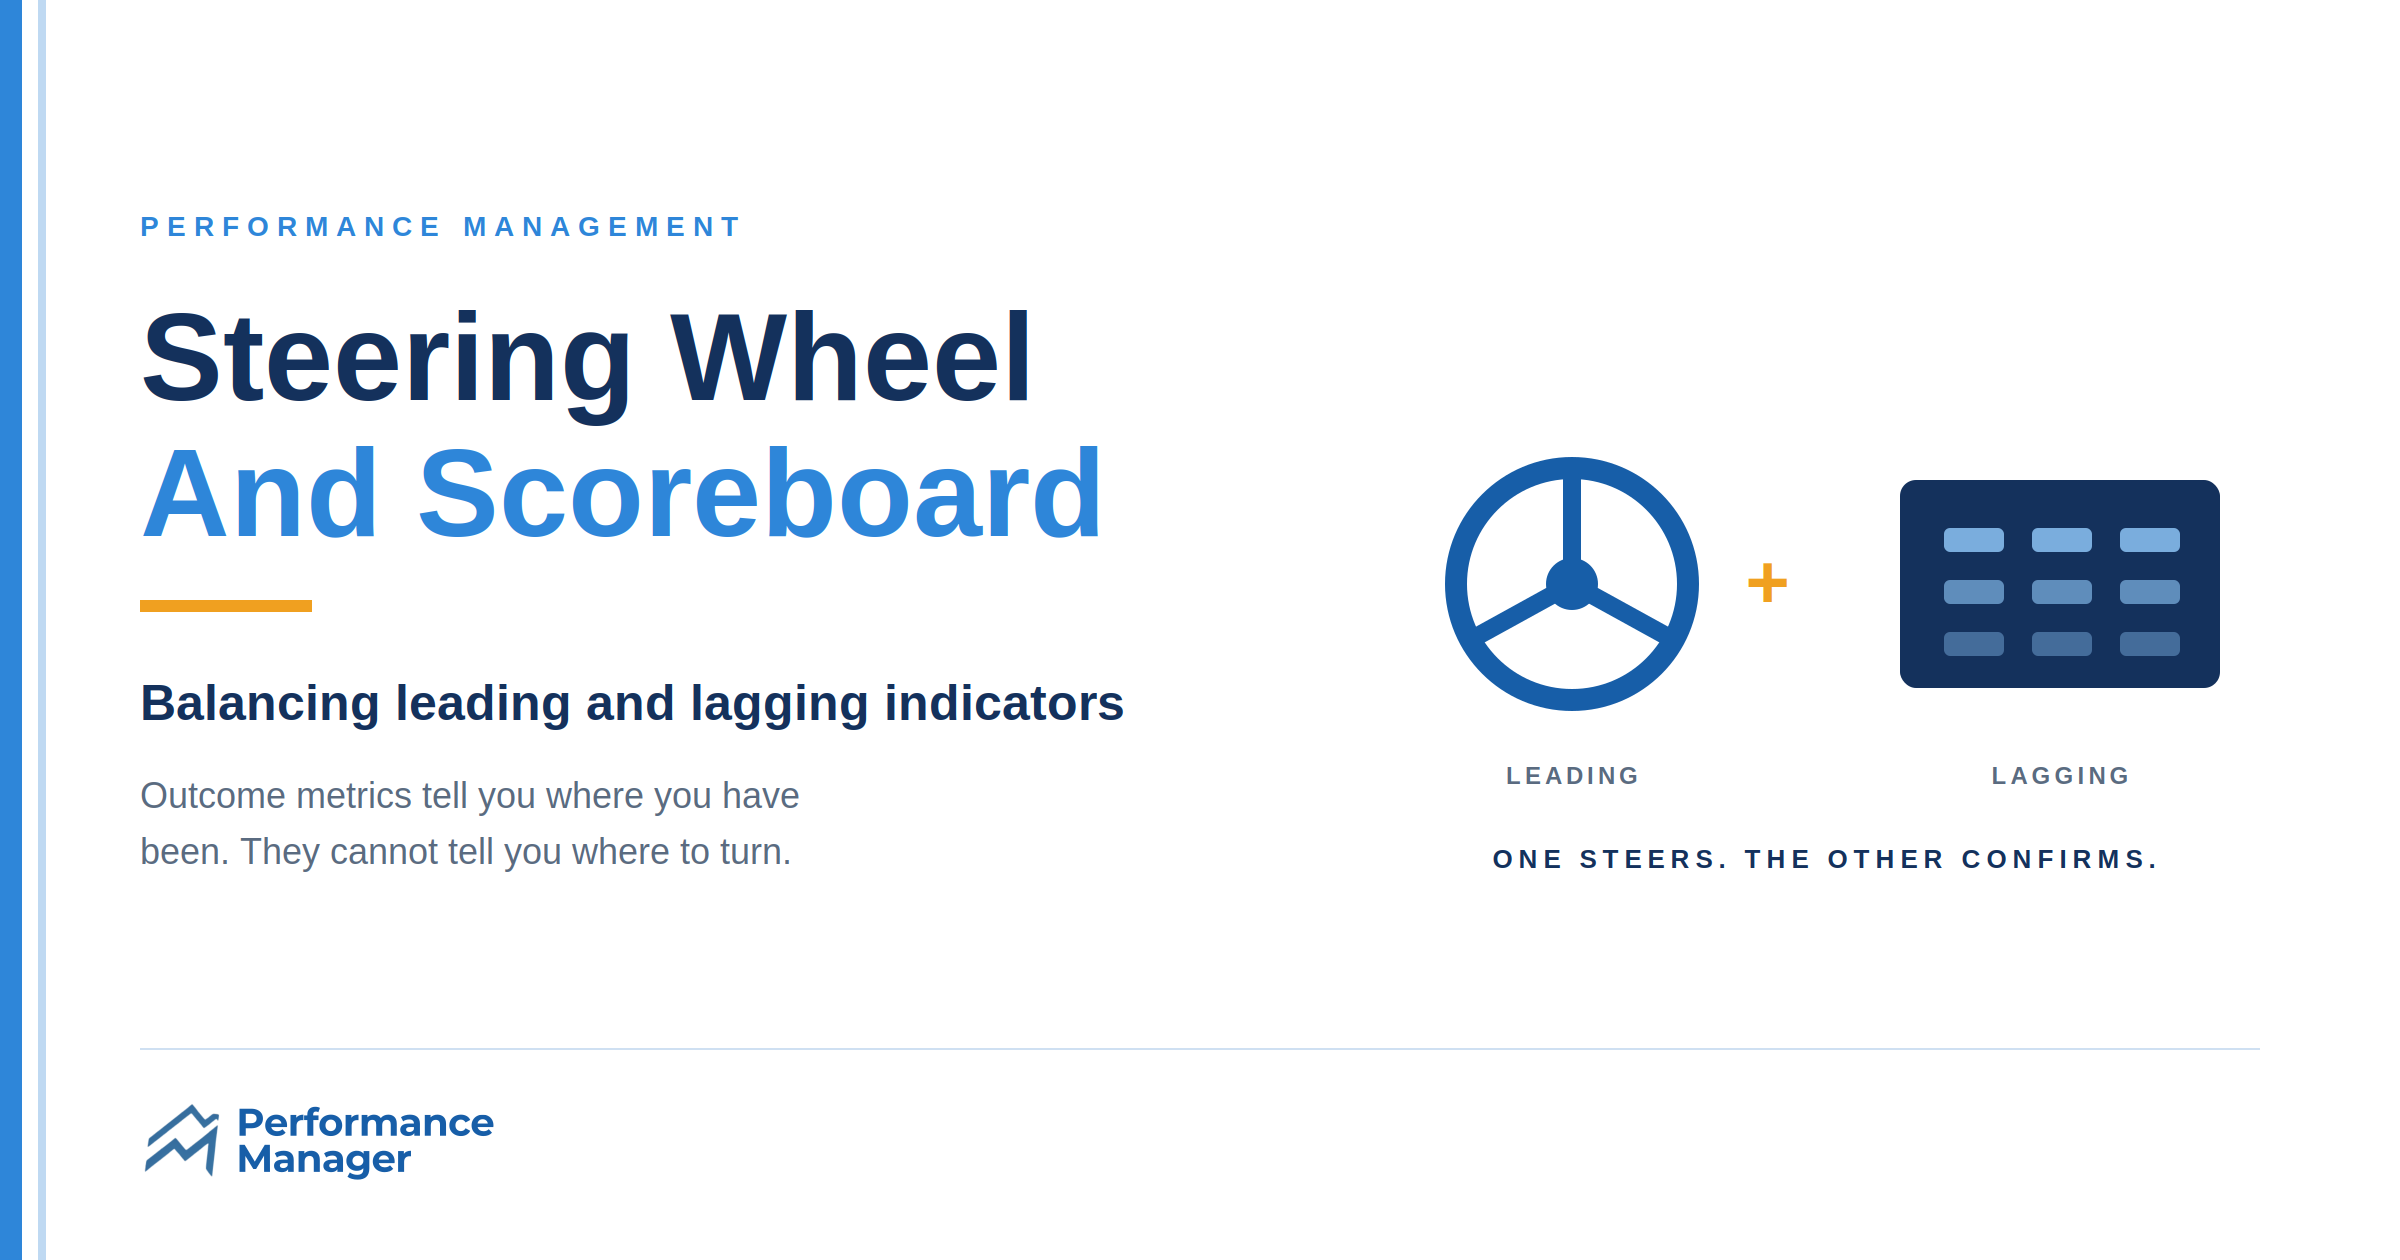
Lagging indicators are essential, but they are a scoreboard, not a steering wheel.
Why Organizations Over-Rely on Lagging Metrics
Structural and cultural reasons drive companies to lean heavily on lagging data.
1. Certainty and Political Safety
Revenue numbers are concrete. Profit margins are factual. No interpretation required. Predictive metrics, by contrast, involve probabilities and assumptions, which can feel uncomfortable in risk-averse environments.
2. Financial Reporting Structures
Quarterly earnings, annual audits, and compliance frameworks are built around outcomes. This institutionalizes lagging measurement.
3. Simplicity
It is easier to measure what already happened than to model what might happen.
But organizations that rely only on lagging metrics become reactive. They diagnose problems after the damage is done.
What Are Leading Indicators?
Leading indicators measure activities, behaviors, and conditions that predict future results.
They answer the question:
“What needs to happen today to produce tomorrow’s outcomes?”
Examples of Leading Indicators:
Number of qualified sales calls per week
Website traffic trends
Employee engagement levels
Customer onboarding completion rates
Training completion rates
Product defect rates during development
Leading indicators are predictive, not definitive. They are grounded in causal relationships — the belief that certain behaviors drive certain outcomes.
The stronger the causal link, the stronger the indicator.
The Causal Chain: How Leading and Lagging Indicators Connect
One of the most influential performance frameworks, the Balanced Scorecard by Robert Kaplan and David Norton, highlights the idea that financial outcomes are produced by a chain of upstream drivers.
Consider a consulting firm:
Lagging Outcome: Revenue growth
Revenue depends on client retention
Retention depends on client satisfaction
Satisfaction depends on quality of deliverables
Quality depends on employee skills and capacity
Skills depend on training and knowledge development
Each step represents a measurement opportunity.
The further upstream you measure, the more time you have to intervene.
The further downstream you measure, the more certainty you gain.
Strategic performance management requires measuring across the entire chain.
Leading and Lagging Indicators Are Relative
A subtle but important insight:
Whether a metric is leading or lagging depends on context.
For example:
Customer satisfaction is lagging relative to service quality.
But customer satisfaction is leading relative to retention.
Employee engagement is lagging relative to management behavior.
But leading relative to productivity and turnover.
There is no universal list of “leading metrics.”
Indicators must be defined within your organization’s unique causal structure.

How to Balance Leading and Lagging Indicators
Balancing metrics requires intentional design — not simply adding more data to dashboards.
1. Start With the Outcome
Define your ultimate lagging result clearly:
Revenue growth?
Customer lifetime value?
Employee retention?
Operational efficiency?
Clarity at this stage prevents misalignment later.
2. Work Backwards to Identify Drivers
Ask:
What must be true for this outcome to occur?
What behaviors or conditions precede it?
What happens one month, three months, or six months before the result appears?
This mapping reveals your potential leading indicators.
3. Validate the Causal Links
Avoid assuming that activity equals impact.
For example:
Do training completion rates correlate with improved customer satisfaction?
Do onboarding metrics correlate with retention?
Do engagement scores correlate with productivity?
Use data analysis to confirm relationships. Correlation does not guarantee causation — but it strengthens confidence.
4. Match Metrics to Decision Cycles
Different decisions require different metric emphasis:
Decision Type | Primary Metric Focus |
Strategic planning | Lagging indicators |
Budget allocation | Lagging indicators |
Weekly operations | Leading indicators |
Team coaching | Leading indicators |
A practical rule:
The shorter the decision cycle, the more you rely on leading indicators.
5. Limit Dashboard Overload
More metrics do not equal better performance.
Research consistently shows that excessive metrics create:
Confusion
Reduced accountability
Metric gaming behavior
Focus drives performance.
Common Pitfalls in Metrics Balancing
Measuring What Is Easy
Organizations often measure call volume instead of call quality. Or output instead of impact.
Easy does not mean meaningful.
Turning Leading Indicators Into Targets
When predictive metrics become rigid targets, behavior distorts.
For example:
Sales teams inflate call numbers with low-quality calls.
Support teams rush ticket closures to hit time targets.
This dynamic reflects Goodhart’s Law:
When a measure becomes a target, it ceases to be a good measure.
Failing to Review Metrics Regularly
Markets evolve. Customer behavior changes. Competitive conditions shift.
A leading indicator that worked two years ago may no longer predict anything.
Metrics frameworks require periodic review and recalibration.
Case Example: Applying Balanced Indicators in Practice
Consider a mid-sized software company experiencing stagnant growth.
Their dashboard focuses on:
Monthly recurring revenue
Churn rate
Net promoter score
All lagging indicators.
Performance appears stable — but growth has plateaued.
After analyzing historical data, they identify three predictive drivers:
Customers completing onboarding within two weeks
Usage of at least three core features in the first month
Engagement with customer success within 90 days
These become weekly tracked leading indicators.
Customer success teams intervene proactively when signals weaken.
Within two quarters:
Early churn drops significantly
Retention improves
Revenue growth resumes
The lagging metrics improve — because leading indicators were managed early.
Why Balanced Measurement Is Strategic, Not Technical
Balancing leading and lagging indicators is not just about analytics. It is about mindset.
Organizations that rely only on lagging data are reactive.
Organizations that integrate leading indicators become proactive.
Balanced measurement enables:
Early intervention
Smarter resource allocation
Stronger accountability
Clearer alignment between daily work and strategic goals
Performance management shifts from reporting history to shaping the future.
Integrating Leading and Lagging Indicators Into Your Performance Management System
For measurement to truly drive impact, it must be embedded in a structured performance management framework.
An effective performance management system should:
Align strategic goals with measurable outcomes
Link departmental initiatives to predictive drivers
Connect daily operational work to organizational objectives
Document KPIs clearly and consistently
Provide transparency across teams
When leading and lagging indicators are documented properly and aligned within a unified system, organizations gain:
Clarity of direction
Improved cross-functional alignment
Greater accountability
Stronger execution discipline
The key is not simply collecting metrics; it is aligning them across strategy, initiatives, and behind-the-scenes operational work.
Frequently Asked Questions About Leading and Lagging Indicators
What is the main difference between leading and lagging indicators?
Lagging indicators measure outcomes that have already happened. Leading indicators measure activities and conditions that predict future results.
Are leading indicators always better?
No. Leading indicators provide early signals, but lagging indicators confirm whether strategy worked. Both are necessary.
Can one metric be both leading and lagging?
Yes. It depends on context and what outcome it precedes or follows in the causal chain.
Final Thoughts: From Rearview Mirror to Navigation System
A business that relies only on lagging indicators is driving using the rearview mirror. It sees clearly where it has been but not where it is going.
A business that incorporates leading indicators gains forward visibility.
The real advantage comes from balance.
When leading and lagging indicators work together:
Strategy becomes measurable
Execution becomes aligned
Problems are addressed before they escalate
Performance management becomes proactive
Done well, a balanced metrics framework transforms data from a reporting ritual into a strategic navigation system.
And in competitive markets, that shift in perspective can make all the difference.