
Introduction: The Modern Analytics Paradox
Over the last decade, organizations have poured significant resources into Business Intelligence platforms. Power BI licenses are approved at scale. Dashboards are implemented in departments. The process of reporting is centralized, automated, and visualized.
However, despite the technological advancement, numerous leaders will complain of the same old aggravation; the quality of decisions made has not changed significantly.
Now meetings are still based on intuition. Teams export data into spreadsheets “just to be safe.” Performance conversations circle explanations instead of actions. The tools exist, but the behaviour has not changed.
This paradox reveals a fundamental misunderstanding. Analytics capability is not created by software alone. It emerges when technology is matched with human competency. Without data literacy, even the most sophisticated BI platform becomes a passive display rather than an engine of performance.
In this sense, dashboards are not solutions. They are instruments, and instruments are only as effective as the people trained to use them.
The False Promise of Tool-Centric Transformation
Many organizations treat BI implementation as a finish line. Once dashboards are live and data is centralized, the transformation is considered complete.
This assumption is deeply flawed.
Technology changes access to information, not interpretation. It does not teach users how metrics are constructed, what constitutes material variance, or when data should override experience. In the absence of such abilities, dashboards will remain lifeless artefacts that are looked at occasionally, believed in selectively, and are usually ignored altogether.
It is the outcome that can be referred to as cosmetic analytics: the emergence of modernity with no analytical decision-making.
When it comes to making real change, it is not simply about the way people see data, but rather how they think with it.
The “Black Box” Problem
One of the most common outcomes of low data literacy is the emergence of the dashboard as a black box.
Users see numbers, charts, and color-coded indicators, but do not understand:
how metrics are calculated
which assumptions are embedded
how data flows from source systems
what limitations exist
When results change unexpectedly, confusion replaces confidence. Instead of interrogating the data, users question the tool.
This lack of understanding triggers predictable defensive behaviours. Teams export data into Excel to “recalculate.” Parallel reports emerge. Shadow metrics proliferate. Trust fragments.
Ironically, the more automated and sophisticated the system, the faster this regression occurs when literacy is absent. Complexity without comprehension creates dependency, not empowerment.
Why Teams Revert to Spreadsheets
The persistence of spreadsheets in BI-enabled organizations is often misdiagnosed as resistance to change. In reality, it is a rational response to uncertainty.
Spreadsheets feel controllable. Users can see every formula, trace every number, and adjust assumptions manually. Dashboards, by contrast, feel opaque when literacy is low.
This is not a technological breakdown- it is a skills gap.
Unless users get to know how to navigate, interpret, and trust automated reporting environments, they will fall back to tools that give them a sense of psychological safety, though they might be slower, riskier, and less scalable.
Data Literacy as an Organizational Capability
Data literacy is often misunderstood as technical skill. In reality, it is a combination of conceptual, analytical, and decision-making competencies.
A data-literate workforce understands:
what a metric is designed to represent
how to distinguish correlation from causation
when variation is meaningful versus random
how to ask the right follow-up questions
This literacy enables people to move beyond observation into interpretation.
These skills will cease to be optional. With the increase in the volume of data and the amplification of automated reporting, the restraining aspect is no longer access but sense-making.
Those organizations that do not invest in literacy will be engulfed by data without having insight.
Standardization of Meaning: The Hidden Value of Training
One of the most overlooked benefits of BI training is standardization—not of tools, but of interpretation.
Without training, performance signals are interpreted inconsistently:
A red indicator triggers escalation in one department and indifference in another
An amber signal is seen as acceptable by some and alarming by others
Thresholds drift over time as informal norms replace defined standards
This inconsistency undermines alignment. Performance discussions become subjective. Accountability weakens.
Training establishes a shared language of performance. It ensures that everyone understands:
what red, amber, and green actually mean
which variances require action
how metrics link to strategic objectives
Standardization does not eliminate judgment. It creates a common baseline from which judgment can be exercised coherently.

The Behavioural Impact of Literacy
Data literacy does more than improve understanding it changes behaviour.
When users are confident in their interpretation:
They engage more directly with dashboards
They challenge assumptions rather than defend positions
They make decisions earlier, with greater conviction
This behavioural shift is critical. Many organizations mistake low dashboard usage for disinterest. In reality, it is often discomfort disguised as apathy.
Training replaces avoidance with engagement.
Why Dashboards Alone Do Not Drive Action
A common misconception in analytics initiatives is that visibility automatically leads to action. If people can see performance, they will naturally respond.
In practice, visibility without literacy leads to hesitation.
Users may recognize that something has changed, but not know:
whether the change is significant
what is driving it
which levers are within their control
In this uncertainty, the safest response is delay. More data is requested. Additional breakdowns are produced. Action is deferred.
BI training reduces this friction by equipping users with frameworks for interpretation. It shortens the distance between insight and response.
The ROI of Education vs. the ROI of Software
Organizations are comfortable calculating the cost of BI licenses. Training, by contrast, is often treated as discretionary.
This is a strategic miscalculation.
Software ROI is realized only when tools are used effectively. Training is what activates that return.
Well-trained organizations experience:
higher dashboard adoption
reduced reliance on manual reporting
faster decision cycles
fewer data disputes
more consistent execution
Untrained organizations experience tool sprawl, reporting duplication, and persistent dependence on spreadsheets—despite owning advanced platforms.
In many cases, the return on BI training exceeds the return on the software itself, because it ensures the investment is actually leveraged.
From Tool Proficiency to Analytical Thinking
The goal of BI training is not to create software experts. It is to build analytical thinkers.
Effective training shifts the focus from:
How do I click?
toHow do I reason with this information?
Participants learn to:
identify leading versus lagging indicators
interpret trends rather than snapshots
connect metrics to strategic intent
recognize when data contradicts assumptions
At this stage, dashboards stop being endpoints. They become starting points for inquiry.
Data Literacy and Performance Management
In performance management contexts, literacy is especially critical.
Without it:
Targets are treated as absolutes rather than indicators
Variance explanations replace improvement conversations
Metrics are gamed rather than used for learning
With literacy:
Performance data becomes diagnostic
Conversations shift from blame to cause
Teams focus on controllable drivers rather than outcomes alone
This distinction determines whether performance management is punitive or developmental.
Why Training Must Be Continuous
Data literacy is not a one-time intervention.
The concept of data literacy cannot be a single intervention.
With changes in systems, metrics change and strategies change; interpretation skills should change. Companies that view training as a rollout program soon deteriorate.
Sustainable literacy requires:
onboarding programs
role-specific training
refresher sessions
integration with performance cycles
This ensures that analytics capability grows alongside the business.
Conclusion: Capability Is the True Multiplier
Organizations often believe their analytics challenge is technological. In reality, it is human.
Dashboards do not create insight. People do.
Software does not drive performance. Decisions do.
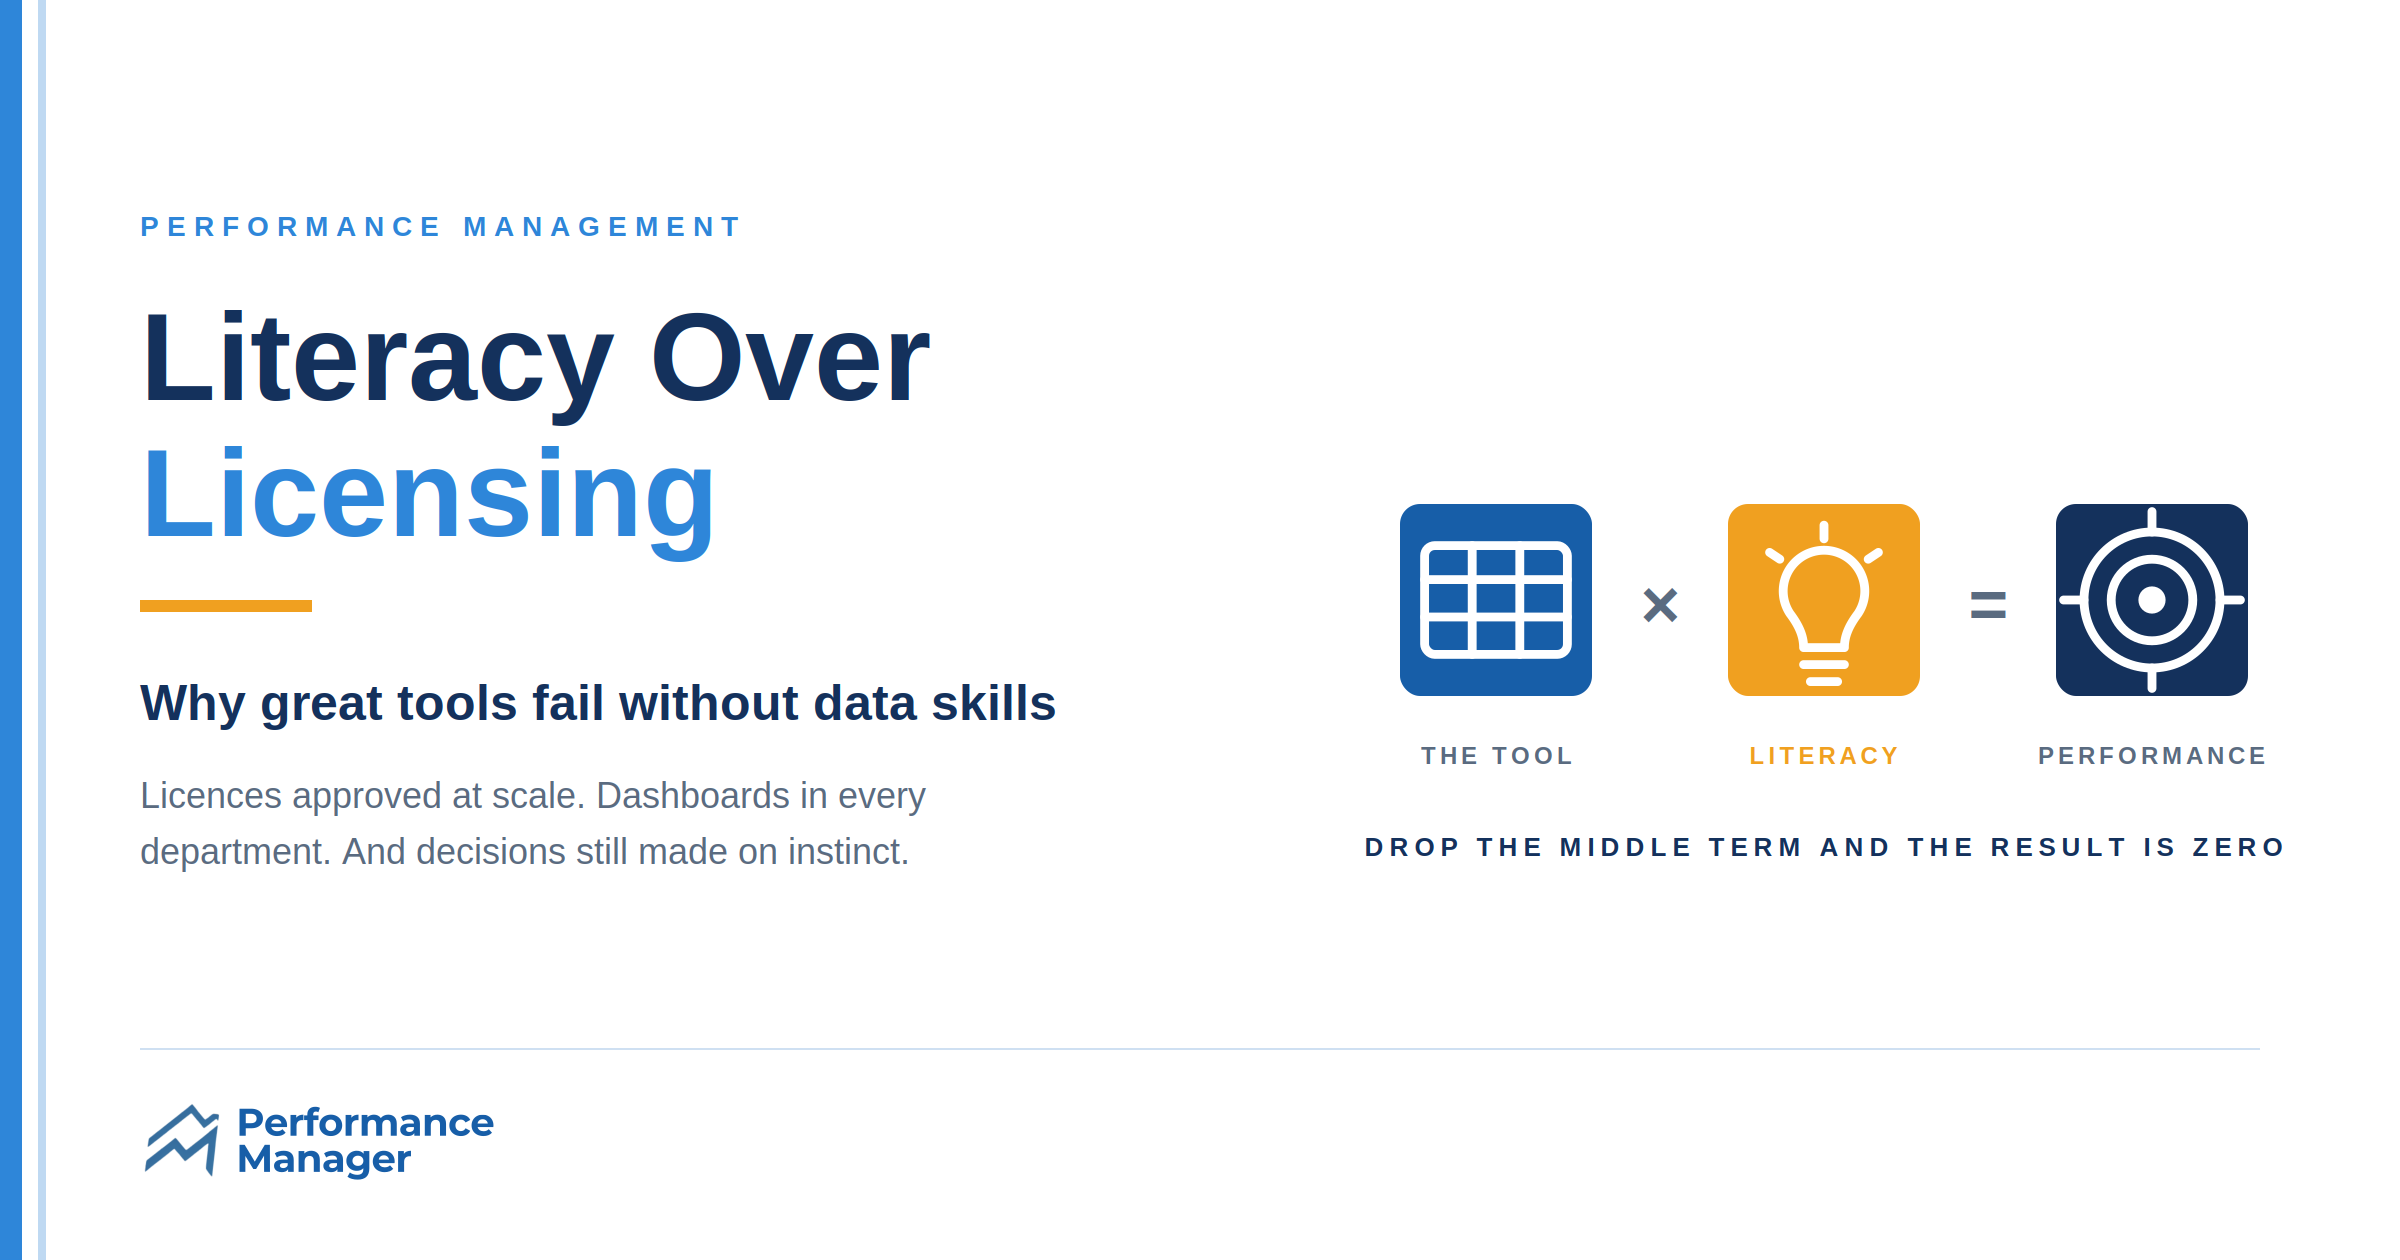
Unless data literacy is developed, the BI tools will remain underused resources, which look impressive but have little impact. Literacy is like multiplying the tools, increasing the speed of clarity, alignment, and implementation.
At a time when there is too much data and the tools are available, competitive advantage is no longer a matter of possession. It comes out of what your people can comprehend and put into practice.
Licensing buys access.
Literacy unlocks value.
And it is literacy, not software, that ultimately turns information into performance.