
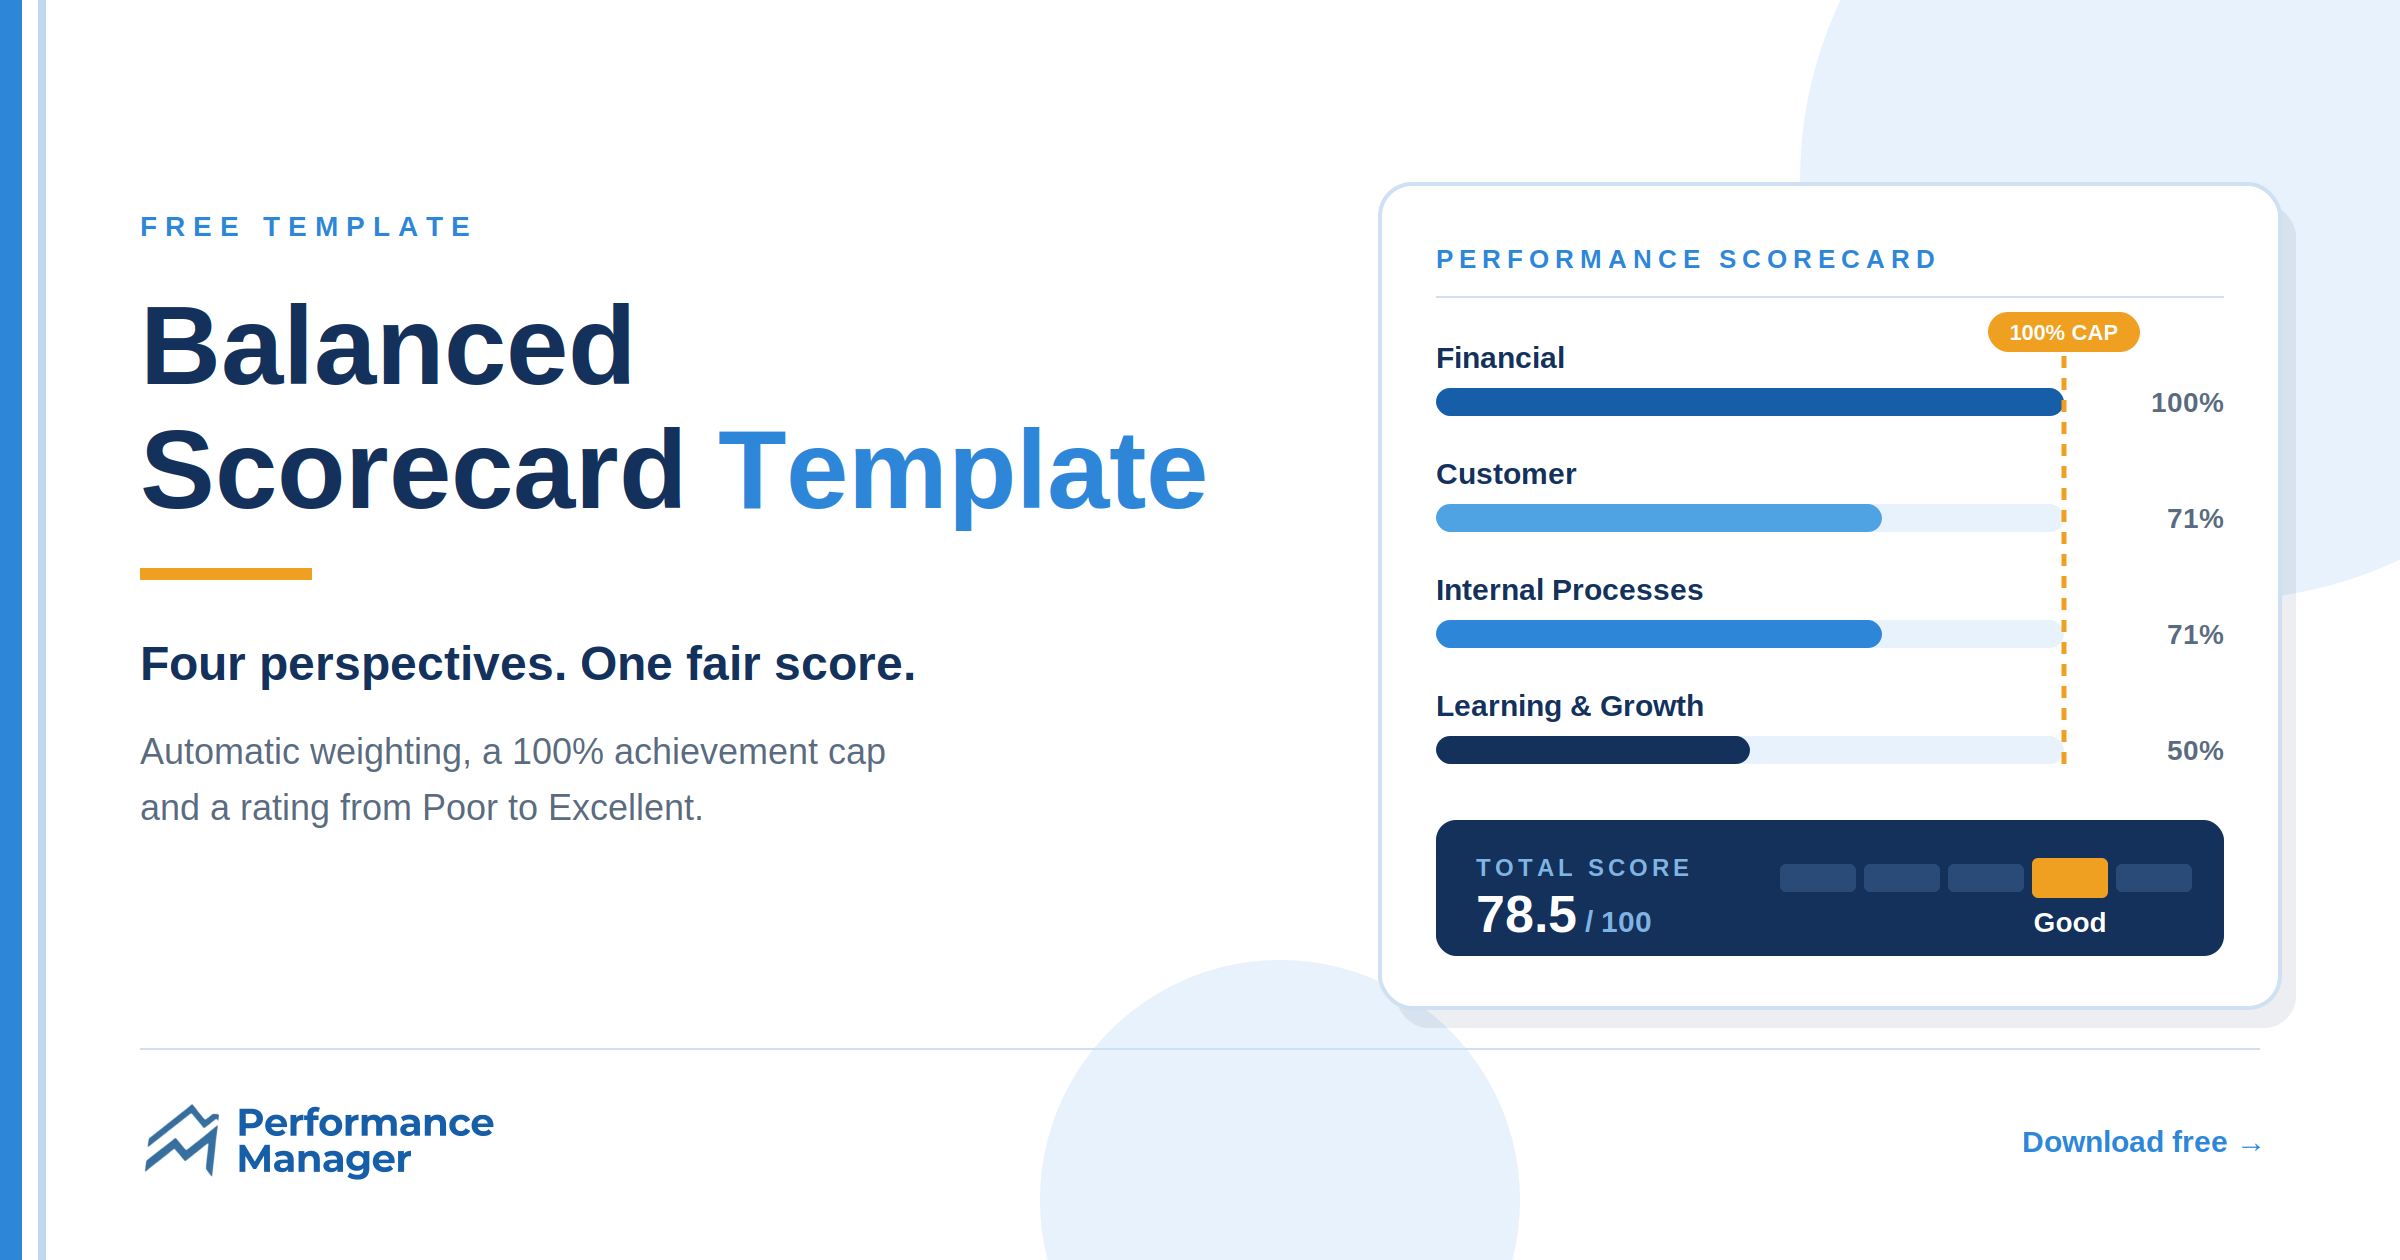
When Harvard Business School professor Robert Kaplan and consultant David Norton introduced the balanced scorecard in their 1992 Harvard Business Review article, The Balanced Scorecard: Measures That Drive Performance, they made a simple point that changed how organisations are managed: financial results alone cannot tell you whether a business is healthy. Financial reports show past performance. Customer, process, and people measures show where performance is heading.
Most balanced scorecard templates stop at the layout. They give you four boxes and leave the hard part to you: turning actual results into a fair, defensible score. The IPC Simplified Balanced Scorecard Template does that scoring for you. It handles metrics where higher is better and metrics where lower is better, weights every KPI, caps overperformance, and converts the total out of 100 into a clear performance rating.
About the Template
The IPC Simplified Balanced Scorecard Template is a practical, ready-to-use framework that helps organisations structure, calculate, and evaluate individual or departmental performance with objective precision. It is designed for team leaders, HR managers, and department heads.
It is built around the four classic balanced scorecard perspectives: Financial, Customer, Internal Processes, and Learning and Growth. Automated formulas remove the guesswork by calculating achievement for both Increase is Better and Decrease is Better metrics, applying allocated weights that total 100 points, capping achievement at 100 percent, and converting the result to a standardised five-band rating scale. You enter only the Target, the Actual, and the Allocated Weight; the sheet calculates everything else.
What Is a Balanced Scorecard?
A balanced scorecard is a performance management framework that measures results from four connected angles instead of relying on financial figures alone. Kaplan and Norton kept traditional financial measures and added three further perspectives: customers, internal business processes, and learning and growth.
In a follow-up article, Using the Balanced Scorecard as a Strategic Management System, they showed how the scorecard fixes a serious weakness in traditional management systems: the inability to link a company's long-term strategy with its short-term actions. That remains the main reason organisations use it today.
The framework has lasted. In Bain and Company's Management Tools and Trends survey, 38 percent of respondents reported using the balanced scorecard. Bain's research also carries a warning. The balanced scorecard was rated the third-highest tool when used as part of a major effort, but tied for 17th when used only on a limited basis. A scorecard only works when it is applied with structure and rigour, and that is what this template is built to enforce.
The Four Perspectives of the Balanced Scorecard
Each perspective answers one question about performance. As Spider Strategies' balanced scorecard guide explains, the perspectives build on each other: capable people improve processes, better processes serve customers well, and satisfied customers drive financial results.

Perspective | Key question | Sample KPIs |
Financial | How do we look to shareholders? | Net profit margin, revenue growth rate, operating cash flow, return on investment, cost-to-income ratio |
Customer | How do customers see us? | Net Promoter Score, customer lifetime value, churn rate, first contact resolution, customer satisfaction score |
Internal Processes | What must we excel at? | Order fulfilment time, defect rate, on-time delivery rate, service level agreement compliance, turnaround time |
Learning and Growth | How can we continue to improve and create value? | Training hours per employee, internal promotion rate, skills matrix competency, employee retention |
Table 1: The four perspectives, the question each answers and example KPIs
What Is Included Inside
1. Perspectives | 2. Directionality | 3. Capped scoring | 4. Rating |
Financial, Customer, Internal Processes, Learning and Growth | I for Increase is Better (revenue, satisfaction); D for Decrease is Better (costs, churn) | Each KPI is capped at 100%, so beating a target earns no extra points | Total out of 100 converts automatically to a rating from Poor to Excellent |
Table 2: The IPC balanced scorecard engine at a glance
Structured four-perspective layout. Pre-formatted sections for strategic objectives, KPIs, units of measurement, baselines, targets and actual results.
Smart directional formula engine. Built in logic calculates true achievement based on the direction of each metric, so a cost ratio is scored differently from revenue.
Weight distribution balancing. Give every KPI an Allocated Weight in points. The weights across all four perspectives add up to 100, so the total score is always out of 100.
Achievement capping guardrails. Achievement on each KPI is capped at 100 percent, so a runaway result in one area cannot disguise a failure elsewhere on the scorecard.
Standardised five band rating scale. The total weighted score converts automatically into one of five clear, defensible ratings: Excellent, Good, Average, Below Standard or Poor.
How the Scoring Works
This is where most scorecards break down, and where this template does the heavy lifting.
1. Achievement follows the direction of the metric
Standard formulas break when you measure cost reduction or turnaround time, because a lower number is a better outcome. The template handles both directions automatically:
I (Increase is Better): Achievement % = Actual ÷ Target Example: target 100, actual 84 = 84% achievement D (Decrease is Better): Achievement % = Target ÷ Actual Example: cost target $10,000, actual $8,000 = 125%, capped at 100% |
2. Achievement is capped at 100 percent
An uncapped ratio is a serious risk in performance appraisals. If an employee reaches 300 percent on an easy volume metric, an uncapped formula can hide complete failure on customer satisfaction or process quality. Capping each KPI keeps the appraisal balanced and defensible, which is the whole point of a balanced scorecard.

3. Achievement is multiplied by the Allocated Weight
Each KPI carries an Allocated Weight in points that reflects its importance to the role. An 84 percent achievement on a KPI with a weight of 7 produces a Performance Score of 5.88 (0.84 × 7).
4. Scores roll up to a total out of 100
Performance Scores add up within each perspective, then across all four perspectives, to a single total out of 100. Because the weights total 100, a person who meets every target scores exactly 100. That total converts to the performance rating.
You never type in the calculated columns. The Performance Score column, all perspective totals, the total weighted score, and the performance rating are calculated by the sheet. You enter only the Target, the Actual, and the Allocated Weight. |
Worked Example: How the Cap Changes the Rating
Consider a sales manager who far exceeds the revenue target but falls short everywhere else.
Perspective | KPI | I / D | Target | Actual | Achievement | Weight |
Financial | Revenue | I | $1.0m | $1.5m | 150% → 100% | 30 |
Financial | Cost to income ratio | D | 60% | 66% | 90.9% | 10 |
Customer | Customer satisfaction | I | 85% | 60% | 70.6% | 25 |
Internal Processes | Turnaround (days) | D | 5 | 7 | 71.4% | 20 |
Learning and Growth | Training hours | I | 40 | 20 | 50.0% | 15 |
Table 3: Worked example with achievement capped at 100 percent and weights totalling 100
Calculation | Total score (out of 100) | Rating |
With the 100% cap (IPC template) | 78.5 | Good |
Without a cap | 93.5 | Excellent |
Table 4: Effect of capping on the final rating

Without the cap, one outstanding revenue figure would lift this manager to Excellent despite weak customer, process and development results. With the cap, the rating reflects balanced performance.
The Five Band Rating Scale
Total score | Rating | Definition |
80 to 100 | Excellent | Outstanding; consistently exceeds the requirements of the role. |
60 to 79 | Good | Meets and frequently exceeds the expected standard. |
40 to 59 | Average | Meets the expected standard. |
20 to 39 | Below Standard | Partially meets the requirements of the role. |
0 to 19 | Poor | Seldom meets the requirements of the role. |
Table 5: IPC performance rating scale

How to Use the Template in Six Steps
Start with strategy, not metrics. Write down the three to five priorities that matter most for the role or department this period.
Set two to four objectives per perspective. Begin each with a verb such as Improve, Reduce or Increase, and keep them within the person's control.
Choose one or two KPIs per objective. Mix lagging indicators such as revenue with leading indicators such as training completed. Too many KPIs dilutes focus.
Set the direction, target, and unit for every KPI. Mark each I (Increase is Better) or D (Decrease is Better) in the INC/DEC BETTER column so the formulas calculate correctly.
Assign weights. Enter an Allocated Weight for every KPI, giving the most points to what matters most, and confirm the weights add up to 100.
Record actuals and review. Enter results each quarter, read the rating, and agree on actions for any KPI below target.
Common Balanced Scorecard Mistakes to Avoid
Measuring everything. A scorecard with 30 KPIs tells you nothing. Focus beats volume.
Ignoring metric direction. Treating a cost or error rate as higher is better produces misleading scores.
Letting one result carry the score. Uncapped overachievement defeats the purpose of balance.
Reviewing once a year. Quarterly check-ins give time to correct course before the annual appraisal.
Choosing KPIs people cannot influence. If an employee cannot move a number, it does not belong on their scorecard.
Who This Template Is For
Small teams and startups. Ideal for small organisations and individual managers who need a structured, manual framework for annual or quarterly appraisals without any software setup.
Growing and enterprise teams. While ideal for tracking a single role or department, larger teams managing multiple departments, layered cascading, peer calibration, and company-wide rollups will outgrow isolated spreadsheets.
Spreadsheet Template or Automated Platform?
A spreadsheet is a fast, low-cost starting point. As monday.com's balanced scorecard guide notes, spreadsheet scorecards bring version control problems, manual data entry, and limited collaboration as programmes grow. Cascade makes a similar point: the value comes from connecting scorecard objectives to real execution across teams.
Capability | IPC Free Template (spreadsheet) | IPC Performance Manager (cloud platform) |
Ideal for | Small teams, startups, single department use (1 to 5 users) | Growing organisations, multi-department enterprises, cross-functional teams |
Setup effort | None; instant download | Rapid cloud configuration and HRIS integration |
Cascading strategy | Manual copying across sheets | Automated multi-tier cascading from company to employee level |
Data aggregation | Manual entry per employee | Automated real-time roll-ups and consolidated dashboards |
Data integrity and audit | Susceptible to broken formulas and file overwrites | Role-based security, version control and audit logs |
Reviews and feedback | Manual appraisal reviews | Automated 360-degree reviews, manager approvals and calibration workflows |
Table 6: Spreadsheet template compared with IPC Performance Manager
Rule of thumb: if you manage more than about ten users or more than one department, the time spent consolidating spreadsheets will soon outweigh the cost of an automated platform.
Download Your Template or Scale Your System
1. Download the IPC Simplified Balanced Scorecard Template Get your free copy with smart formulas, capped calculations, and the five-band rating scale, ready for your next quarterly appraisal. 2. Ready for multi-tier cascading and automated roll-ups? Need multi-tier cascading, automated roll-ups, 360-degree reviews, and real-time audit trails? Book a Free Performance Manager Demo to see our fully automated platform in action. |
Frequently Asked Questions
What is a balanced scorecard template?
A ready-made framework for recording objectives, KPIs, targets, and results across the Financial, Customer, Internal Processes, and Learning and Growth perspectives. The IPC template also calculates weighted scores and ratings automatically.
How do you calculate a balanced scorecard score?
Calculate achievement for each KPI: actual divided by target when higher is better, or target divided by actual when lower is better. Cap each result at 100 percent, multiply by the KPI's Allocated Weight, and add the Performance Scores across all four perspectives to get a total out of 100.
Why is achievement capped at 100 percent?
Beating a target earns no extra points, so one runaway result cannot disguise a failure elsewhere on the scorecard. The final rating reflects balanced performance and stays defensible in an appraisal.
How many KPIs should a balanced scorecard have?
For an individual or department, aim for two to four objectives per perspective and one or two KPIs per objective.
Can I use a balanced scorecard for individual performance appraisals?
Yes. The framework was designed for organisations, but it cascades well to departments and individuals. This template is built specifically for individual and departmental appraisals.
How often should a balanced scorecard be reviewed?
Quarterly reviews with an annual summary work well for most teams, allowing early correction without heavy administration.